Section 3: A Thousand Writes for Every Read - Scale Estimation & Workload Analysis
Executive Summary: This section derives, out loud, every number the rest of the design will spend. Starting from 10 million properties and 2 billion daily client IDs, we unfold hits per second, peak and design capacity, bandwidth, raw and aggregate storage, Kafka sizing, collector count, concurrent session state, report QPS and the size of a unique-count sketch. Then comes the part that earns 401 credit: picking out the few numbers that force architectural decisions. Hits outnumber report queries 1,000 to 1, but the cheap side is the writes. Each one is an append, while each read is a scan-and-merge whose cost grows with the date range. So the paths split. The skew in traffic creates hot properties, and petabytes of raw data make columnar compression mandatory.
Section 2 left a table of promises: 99.99% collection, 2-second reports, a 60-second real-time card. The interviewer taps it: "Sized against what?" For a write firehose, estimation is part of the design itself. Each figure below becomes a budget that a later mechanism has to pay. The interviewer will also check whether Section 7 quotes the same number you derive here.
The Napkin, Line by Line
The interviewer stipulates two anchors: 10M active properties and 2B daily active client IDs. Everything else follows from those two and a few stated assumptions:
POPULATION & TRAFFIC
  Properties                 10M active; top 1% = 100K properties → ~80% of hits
  Daily active client IDs    2B   (per device, per property: one phone on 3 sites = 3 IDs)
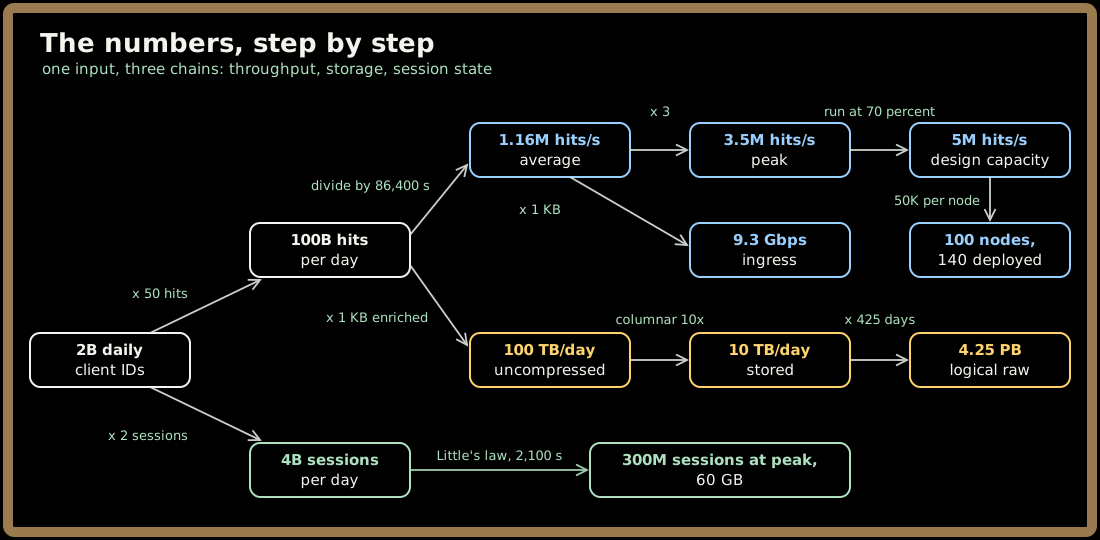
  Hits/day                   2B × 50 hits/client            = 100B hits/day
  Sessions/day               2B × 2 sessions/client         = 4B sessions/day
  Hits per session           100B ÷ 4B                      = 25
  Average ingest             100 × 10⁹ ÷ 86,400 s           = 1,157,407 ≈ 1.16M hits/s
  Peak (3× average)          1.157M × 3                     = 3.47M ≈ 3.5M hits/s
  Design capacity            5M hits/s → 3.5 ÷ 5 = 70% at peak (5 ÷ 3.5 ≈ 1.43, ~40% headroom)
  Requests (2 events each)   1.16M ÷ 2 ≈ 0.58M req/s avg;  3.5M ÷ 2 = 1.75M req/s peak
  Ingress (1 KB/hit)         1.16M × 1 KB = 1.16 GB/s × 8   ≈ 9.3 Gbps average
                             3.5M × 1 KB  = 3.5 GB/s × 8    = 28 Gbps peak
  Bots (~10%, flagged)       100B × 10% = 10B/day kept in raw, excluded from reports

STORAGE
  Raw, enriched              100B × 1 KB                    = 100 TB/day uncompressed
  Columnar (~10×)            100 TB ÷ 10                    = 10 TB/day stored
  Per year                   10 TB × 365                    = 3.65 PB/year
  14-month retention         425 days × 10 TB               = 4.25 PB logical
  Erasure coding (~1.5×)     4.25 PB × 1.5                  = 6.375 ≈ 6.4 PB physical
  Cubes                      ~30 cubes, ≤ 50,000 rows/property/day each
                             ≈ 1 TB/day (~10% of raw compressed) → ~365 TB/year, kept forever
  Kafka (lz4 ~4×)            100 TB ÷ 4                     = 25 TB/day on the log
  Kafka disk                 25 TB × 3 days × RF 3          = 225 TB broker disk
  Kafka peak produce         3.5 GB/s ÷ 4                   = 875 MB/s compressed
  Per partition              875 MB/s ÷ 2,048               ≈ 0.43 MB/s at peak

COMPUTE
  Collectors (50K hits/s)    5M ÷ 50K                       = 100 nodes of capacity
  Deployed                   100 ÷ 20 regions = 5/region, N+2 = 7 × 20 = 140 nodes
  Session starts             4B ÷ 86,400 s                  ≈ 46.3K/s
  Session lifetime           ~5 min active + 30 min timeout = 2,100 s
  Concurrent states          46.3K/s × 2,100 s              ≈ 97M ≈ 100M avg; ~300M at peak
  State size (~200 B each)   300M × 200 B                   = 60 GB at peak

REPORTING
  Queries/day                2M users × 10 views × 5 widgets = 100M queries/day
  Report QPS                 100M ÷ 86,400 s                ≈ 1,157 ≈ 1.2K avg; ~3.5K peak
  Write:read                 1.16M hits/s ÷ 1.16K queries/s ≈ 1,000:1
  HLL++ users (p=14)         2¹⁴ = 16,384 registers × 6 bits = 98,304 bits ≈ 12 KB
                             std error 1.04 ÷ √16,384 = 1.04 ÷ 128 ≈ 0.81%
  HLL++ sessions (p=12)      4,096 × 6 bits = 3 KB;  1.04 ÷ 64 ≈ 1.6%

RUNNING EXAMPLE
  Trailhead P-40213          3M hits/day ÷ 86,400           ≈ 35 hits/s
  News site P-90001          250K hits/s ÷ 3.5M             ≈ 7% of global peak
    keyed by property alone  250K × 1 KB ÷ 4 (lz4)          ≈ 62 MB/s on ONE partition
    keyed by (prop, client)  250K ÷ 2,048                   ≈ 122 hits/s per partition
Two of these lines deserve a sentence of defense before anyone challenges them.
Why 3× for peak? A single global service smooths out some of the daily cycle, because Lisbon wakes up as Denver goes to sleep. But traffic still follows waking hours in the largest markets, and news events stack on top. Three times the average is a judgment call, and saying that aloud is part of the signal. Design capacity is 5M hits/s, not 3.5M. A collection tier promising 99.99% can't run at 100% on its worst evening.
Why does session state use Little's law? The number of sessions open at once equals the arrival rate times how long each one lives. A session is kept for about 5 minutes of activity plus the 30-minute inactivity timeout, so 46.3K starts per second times 2,100 seconds is about 100M open sessions on average. At peak that becomes ~300M, which at ~200 bytes each is 60 GB. That is a modest amount of state, and it fits comfortably in a streaming cluster.
Quick check before moving on:
Sign in to continue reading
The rest of this lesson is available with a free account. Signing in with Google or Microsoft is free.
Sign in to read the full lesson