Section 1: The Tag on Every Page - Problem Understanding & Clarifications
Executive Summary: This section covers the opening minutes of a prompt that sounds like a dashboard and turns out to be a firehose. We decompose "design Google Analytics" into what, who, why and how, and discover that it is really two products — a write path that must swallow every page view on millions of websites, and a read path that must answer analysts' questions in seconds — joined by a pipeline. Then we run the clarifying exchange, where each answer eliminates or creates a category of work — approximate uniques, freshness, 72 hours of late data, ten million tenants, privacy law — and close with the assumptions written down and the cast who will carry the design through every section.
The interviewer reads it off a card, unhurried:
"Design Google Analytics. Millions of websites paste a JavaScript tag into their pages; every page view and interaction is sent to us. Site owners log in and see dashboards — users, sessions, top pages, traffic sources — for any date range, plus a live 'users on your site right now' card."
The trap in this prompt is the word dashboards. It invites you to start where the user-visible product lives: charts, a reporting API, a database you query with GROUP BY. Candidates who take that bait spend twenty minutes designing a read path, then discover that the data feeding it arrives at a rate no query-shaped database was ever meant to absorb. The opposite failure is the candidate who hears "every page view" and recites a streaming textbook — Kafka, Flink, exactly-once — without ever asking what the analyst needs the numbers for, or how wrong they are allowed to be.
Key Insight: Read the prompt for its verbs, not its nouns. "Paste a tag", "sent to us", "see dashboards", "right now". "Sent to us" happens on someone else's website, over a million times a second, on behalf of people who never chose to talk to us; "see dashboards" and "right now" happen in our UI, for customers who pay attention to every digit. That asymmetry is the whole design, and the first ten minutes exist to surface it.
Decomposing the Prompt
Run the four-way decomposition, and notice that every dimension splits in two:
- What it does: Collect interaction events from websites and apps, turn them into sessions and users, and answer aggregate questions about them — by dimension, by metric, over any date range — plus a live view of the last few minutes.
- Who uses it: Two audiences who never meet. Visitors generate the data without knowing we exist — they loaded a product page, and a tag fired. They expect nothing from us except that we not slow their page down and not violate their privacy. Site owners and analysts read the data, log in, and judge us on whether the numbers are fast, believable and stable.
- Why it exists: Site owners cannot improve what they cannot measure — which campaign brought buyers, which page loses them — and no mid-size store wants to run its own event pipeline. We amortize one across every property.
- How it's used: The write side is machine-driven, fire-and-forget, and must survive the page closing mid-request. The read side is human-driven, bursty around Monday mornings, and tolerant of a second or two of latency but not of numbers that silently change.
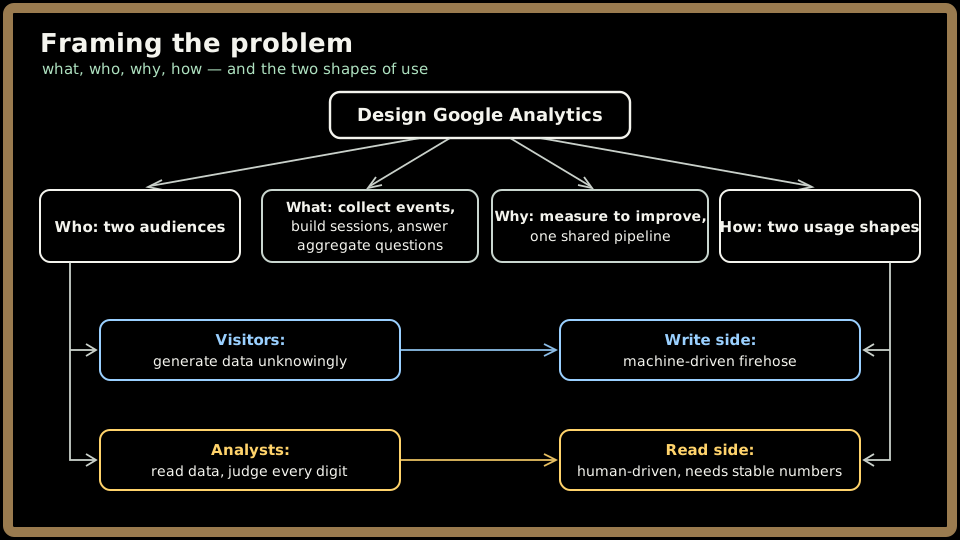
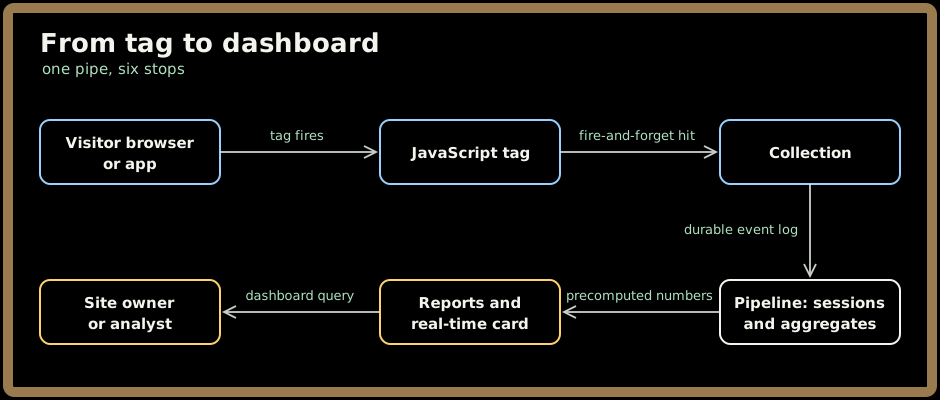
Say the conclusion out loud: this is two products sharing one pipe — a collection product whose customers are web pages, and a reporting product whose customers are people, with different load shapes, failure costs and, as Section 2 will make explicit, availability targets. The pipeline between them is where the hard problems about time live.
Quick check before moving on:
Sign in to continue reading
The rest of this lesson is available with a free account. Signing in with Google or Microsoft is free.
Sign in to read the full lesson