Section 3: The Numbers That Kill Kafka - Scale Estimation & Workload Analysis
Executive Summary: This section turns 2,500 pipelines into arithmetic: 100,000 runs a day, 23 webhook events a second, 4 GB of daily traffic, and a 13-month archive that fits in 40 GB. Every number is laptop-sized — and that is the section's trap and its lesson. The estimate doesn't justify big machinery; it forbids it, and redirects the budget toward correctness, sparse-data semantics, storm fan-in, and the read side. We close by stress-testing the napkin against 20× growth and naming the threshold where the answer changes.
The interviewer caps the marker. "Before you draw anything: how much data is this, really?" Many candidates hear that as permission to say "Kafka." Hold the reflex. At Staff level the napkin is the first architectural decision: the numbers you're about to derive will delete entire categories of design.
You: "Let me anchor the fleet first. You said two thousand plus pipelines; I'll use 2,500 across roughly 300 owner teams and four CI providers. For run volume I'll assume an average of 40 runs per pipeline per day — the average hides a long tail I'll come back to. Stop me if I'm off by an order of magnitude."
Interviewer: "Those are fair."
Runs per Day, Events per Second
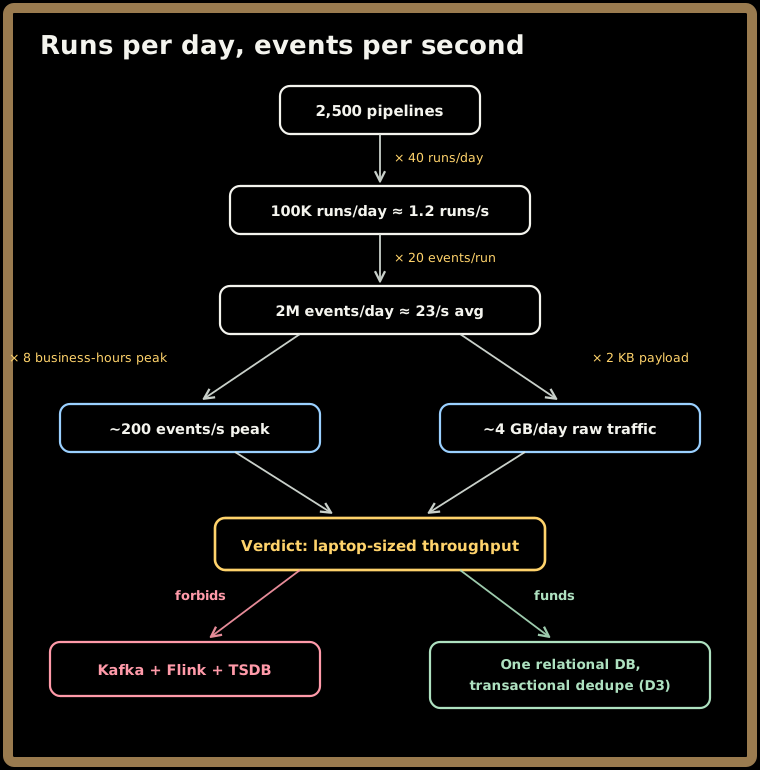
Runs:    2,500 pipelines × 40 runs/day   = 100,000 runs/day
Average: 100,000 ÷ 86,400 s              ≈ 1.2 runs/s
Peak:    business hours concentrate load ×8  ≈ 10 runs/s
One-point-two runs per second. Say it aloud, because the number is already whispering that this system's difficulty won't be throughput.
Runs aren't the unit of ingest, though — webhooks are. A single run emits a stream of events: queued, started, half a dozen stage transitions with their retries, finished. Call it 20 events per run:
Events:  100,000 runs × 20 events       = 2M events/day
Average: 2,000,000 ÷ 86,400 s           ≈ 23 events/s
Peak:    ×8 business-hours factor       ≈ 200 events/s
Payload: ~2 KB each → 2M × 2 KB         ≈ 4 GB/day raw webhook traffic
Twenty-three events a second on average, two hundred at peak, four gigabytes a day. A single modest node handles this without noticing. The estimate just made its first decision: there is no throughput argument for a streaming stack here, and that is the heart of D3 — runs, health state, incidents and policies live in one relational database, with transactions powering dedupe and state transitions. Kafka plus Flink plus a time-series database is a defensible reflex and the wrong answer at 23 events a second: three distributed systems to operate, for a workload a laptop can absorb.
Quick check before moving on:
Sign in to continue reading
The rest of this lesson is available with a free account. Signing in with Google or Microsoft is free.
Sign in to read the full lesson