Section 1: The Firehose That Isn't - Problem Understanding & Clarifications
Executive Summary: This section covers the first ten minutes of a Staff/Principal interview on a CI/CD pipeline health monitoring system. We break the prompt into what, who, why and how, then walk the clarifying exchanges whose answers reshape the design: what "unhealthy" means, which providers feed us, whether we push or pull, what an incident is, and whether acknowledging one stops its escalation. The answers become written assumptions, two early reflexes get named — arithmetic before architecture, and health is not an incident — and the running example arrives: team Orion and two very different pipelines.
The interviewer reads you one sentence:
"You have two thousand plus CI/CD pipelines running across your organization. Design a system that detects when a pipeline's health degrades — consecutive failures, a rising failure rate — automatically creates incidents, and escalates severity based on how long the degradation persists."
Two thousand pipelines. The number is doing exactly what it was planted to do: it sounds like a firehose, and many candidates respond to the sound — Kafka for ingestion, Flink for windowed detection, a time-series database for rates. That reflex is the trap. Section 3 does the arithmetic properly, but the headline: 2,500 pipelines at roughly 40 runs a day produce about 100K runs and 2M webhook events a day — around 23 events per second on average. A laptop handles that. The difficulty here is not capacity but meaning and trust: defining "unhealthy" on sparse, noisy data, turning untrustworthy webhooks into exactly-one incident per outage, and paging humans rarely enough that they keep believing the pages.
Key Insight: This interview inverts the usual scaling test. The data is tiny; the liability is huge. A missed webhook means a missed outage, and a week of false pages means 300 teams mute you. The scarcest resource in this design is not throughput — it is credibility.
Decomposing the Prompt
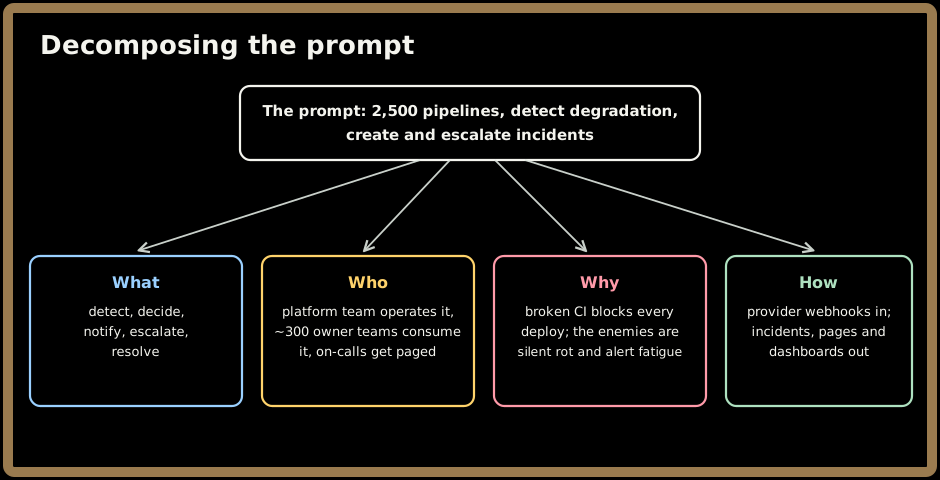
Before asking anything, map the problem in four parts:
- What it does: In verbs — detect degradation from run outcomes, decide whether it warrants an incident, notify the owning team, escalate severity as the degradation persists, and resolve when measurements say it's over.
- Who uses it: A platform team operates it. Roughly 300 owner teams consume its incidents and dashboards. On-call engineers get paged by it at 3 a.m. — the stakeholders whose trust you can least afford to spend.
- Why it exists: A broken pipeline blocks every deploy behind it. The two enemies are silent rot — a pipeline failing for days with nobody noticing — and alert fatigue, which is how monitoring systems die.
- How it's used: Provider webhooks flow in; incidents, pages and dashboards flow out. Humans interact at the edges: acknowledging, resolving, tuning thresholds.
Sign in to continue reading
The rest of this lesson is available with a free account. Signing in with Google or Microsoft is free.
Sign in to read the full lesson