Section 2: The Numbers That Would Page Someone - Requirements (Functional & Non-Functional)
Executive Summary: This section turns Section 1's answers into a contract you can test. We number seven functional requirements, walk Dana's 02:14 incident through them, and group them into three paths (write, read, alert) that the rest of the design keeps separate. Then we set per-path targets for freshness, detection, query latency and availability, state loss semantics out loud, list what we are not building, and defend the number interviewers push on: alerting at 99.99% while search sits at 99.9%.
The interviewer leans back: "Fine. So what are we actually committing to?" The weak answer is "collect logs and metrics, make them searchable, alert when things break." Nobody can test that. Every requirement below is testable, and every number is one that, if missed, should page the platform team.
The Functional Contract
| # | Requirement | What it commits us to |
|---|---|---|
| FR1 | Collect from every host | One agent per host (50,000 of them) tails log files and stdout, scrapes local /metrics endpoints, and pushes batches. No service changes code to be observed. |
| FR2 | Search logs | Filter by labels (service, env, region) plus full text over a time range, back 30 days. A label selector and a time range are mandatory on every query. |
| FR3 | Live tail | Stream lines matching a selector as they arrive, for the engineer watching a deploy. |
| FR4 | Dashboards | Query metric series over time: raw 10 s resolution for 15 days, 1-minute rollups for 30 days, 1-hour rollups for 13 months. |
| FR5 | Alert rules | Rules with an expression, a for: duration, severity, labels, a route and a runbook link. Alerts are grouped, deduplicated, routed to the owning team, and can be silenced. Log patterns (error counts per service) are alertable too. |
| FR6 | Per-service quotas | Every service has a log-rate quota and a series limit. One team's mistake must not degrade anyone else. |
| FR7 | Self-observability | The platform reports its own ingest lag and health, and missing data never reads as "healthy." |
Now walk Dana through it, because a table earns its keep only when a real incident exercises it. At 02:14 UTC on Tuesday, the rule checkout-api p99 latency > 800 ms for 5m has its condition met (FR5), and Dana's phone buzzes about 50 seconds later. Dana opens the checkout dashboard (FR4) and sees payments-gateway errors spiking. They search {service="payments-gateway"} |= "timeout" over the last 30 minutes (FR2), copy request ID req-7f3a9c, and search all services for it. After Dana fails over to card network A, a live tail (FR3) shows the timeouts stop.
FR1 quietly picks a push-based host agent over in-app libraries and central pull; Section 4 (API Design) makes that case.
FR6 and FR7 are functional on purpose. Without FR6, one service's log storm swamps the shared pipeline. Without FR7, a stalled pipeline produces empty graphs, and an empty error-rate graph looks exactly like a healthy one.
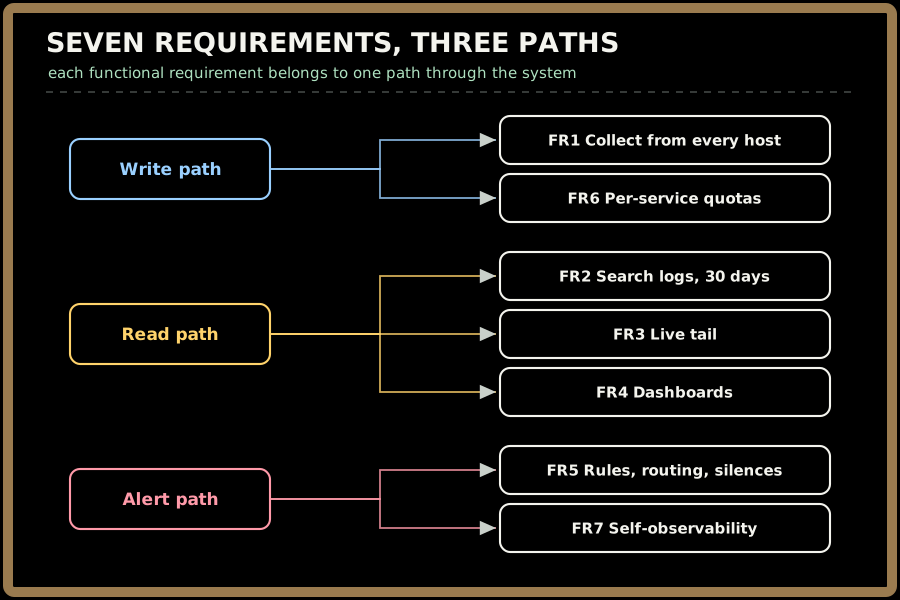
Key Insight: "Logging and monitoring" sounds like one product, but these seven requirements fall into three paths with different shapes. The write path is enormous and constant, the read path bursty and human, the alert path small, relentless and machine-driven. Naming them now lets each get its own target.
Quick check before moving on:
Sign in to continue reading
The rest of this lesson is available with a free account. Signing in with Google or Microsoft is free.
Sign in to read the full lesson