Section 12: What the Hour Was Graded On - Final Summary & Candidate Scorecard
Executive Summary: This section turns the module into a grading tool. It replays the hour as the signals the interviewer was recording, then lays out a 100-point scorecard across five dimensions, each described by what a top answer and a point-losing answer sound like for this problem. Score bands map a total to a readiness level, with a specific fix for each. A final catalog shows where the question hides in real loops (Twitter's home timeline, LinkedIn, activity feeds, a notification inbox, Pinterest) and what changes in each.
The boxes you drew for Maya's 9:00:04 feed open were worth about a quarter of the points. The interviewer was grading something else. Did you find the two numbers that kill the naive designs before anyone asked? Did you say "100K followers" and then say what would move it? Told "just pull everything," did you answer with the tail math? You can't reliably earn points you can't name, so this section names them.
The Arc, Replayed as Signal
The module moved in five phases. This diagram pairs each phase with the signal it was recording.
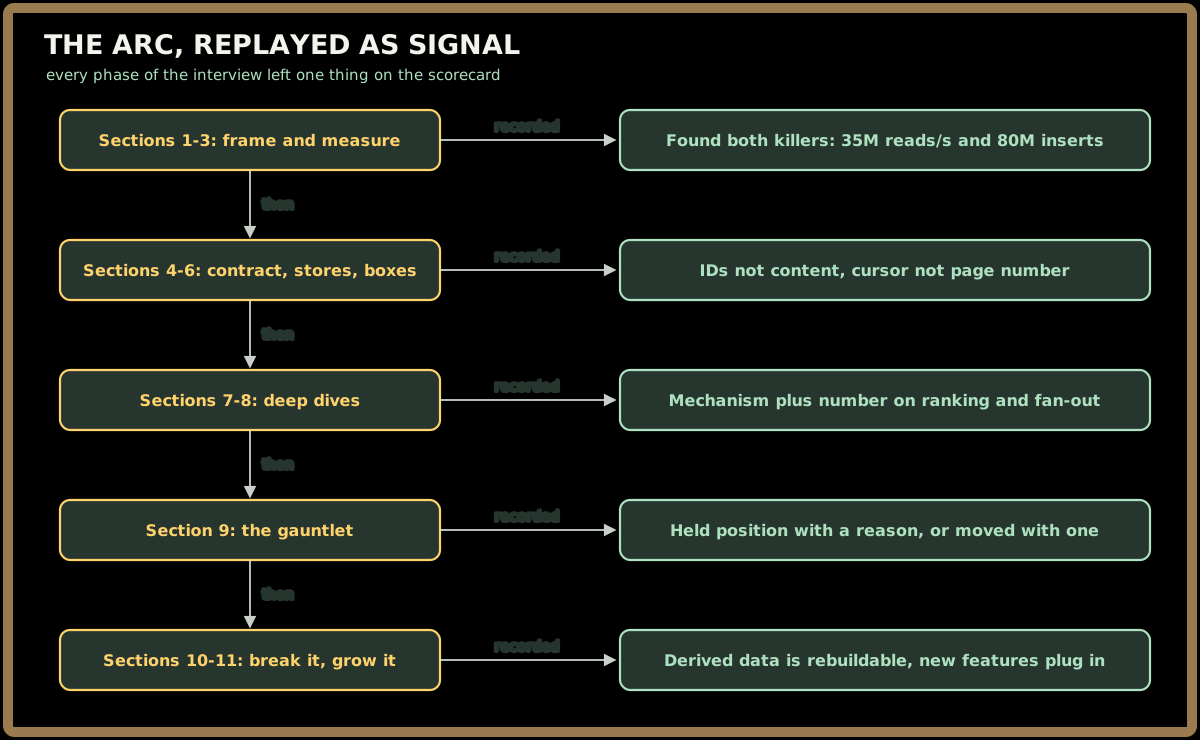
Section 1 named two traps, the Timeline Joiner and the Broadcaster, and Section 3 put a number on each. Pure pull costs 35M timeline reads a second, and 87% of opens hit a slow fetch. Pure push turns one @luna_sings post into 80M inserts (all 80M of her followers are active), 80 seconds of the whole fan-out fleet. Every box after that was the hybrid those two numbers forced.
Key Insight: None of these signals is "knew Redis" or "knew Kafka." Each is about letting a measured number pick the mechanism. The 87% tail is why followee timelines aren't merged at read time. The 80M inserts are why celebrities are pulled. And 16 TB of RAM against only 5.6K inserts/s per shard is why memory, not throughput, sizes the feed cache.
Quick check before moving on:
Sign in to continue reading
The rest of this lesson is available with a free account. Signing in with Google or Microsoft is free.
Sign in to read the full lesson