Section 3: The Arithmetic of Restraint - Scale Estimation & Workload Analysis
Executive Summary: This section derives the Color Picker Service's true scale from first principles: user behavior to daily volume, daily volume to queries per second, record shape to total storage. The results — roughly 120 QPS at peak and about 60 MB of data, ever — become the decisive input for every architectural choice that follows, ruling out caching tiers, sharding, and multi-region machinery before any of them can sneak onto the whiteboard. You'll learn the estimation pipeline that transfers unchanged to systems of any size, and the discipline of letting the numbers veto the architecture.
The interviewer's pen stops moving. "Before you draw anything — how big is this system?" This is the moment that separates candidates who compute from candidates who pose. Capacity estimation is the one skill in the interview that memorized architectures cannot fake: you must derive load from human behavior, in front of another engineer, and then — the step most candidates skip — actually obey the result. Plenty of candidates produce a QPS figure, nod respectfully at it, and then design for a thousand times more "to be safe." The estimate exists precisely so you don't.
The interviewer supplies the raw material: about 100,000 registered users, roughly 10,000 daily actives, mostly US-based, with an internal tool's rhythm — a morning surge as the workday opens, quiet evenings, dead weekends.
From Human Behavior to Requests per Second
The estimation pipeline is always the same, whatever the system: behavior → daily volume → QPS → design consequences. Start with what one user actually does. They load the page (one read of the saved color); some load it several times across tabs and devices — call it 3 reads per active user per day. Changing a color is rare; preferences are sticky. If one in three active users changes it on a given day, that's 0.3 writes per active user per day. State these as assumptions and invite correction — "I'm assuming three reads and a third of a write per user; stop me if usage differs" — because showing that your inputs are negotiable is exactly as important as the multiplication that follows.
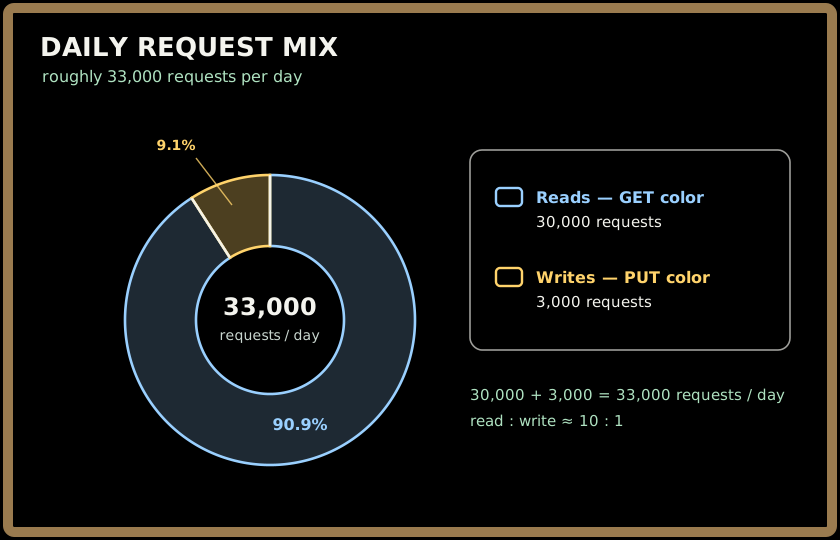
Reads:   10,000 DAU × 3 reads/day        = 30,000 reads/day
Writes:  10,000 DAU × 0.3 writes/day     =  3,000 writes/day
Total:                                     33,000 requests/day

Average QPS (10 active hours = 36,000 s):
  33,000 ÷ 36,000                        ≈ 0.9 QPS
Result: Under one request per second, on average. But averages lie — internal tools compress traffic brutally into the morning. Assume 30% of daily reads land in the first working hour:
Morning spike: 30,000 × 0.30 = 9,000 reads in 3,600 s ≈ 2.5 QPS sustained
Burst factor for sign-in synchronization: ~10×
Design targets (rounded up aggressively):
  GET  ≈ 100 QPS peak
  PUT  ≈  20 QPS peak
  Total ≈ 120 QPS peak — a 30–40× cushion over the arithmetic
Rationale: The cushion is deliberate and bounded. Padding a computed peak by 30× is honest engineering headroom; padding it to 100,000 QPS is cosplay, and the interviewer knows the difference. The read/write mix — 91% reads — matches the interviewer's stated 80–90%, and saying so aloud converts your estimate into a verified one.
Sign in to continue reading
The rest of this lesson is available with a free account. Signing in with Google or Microsoft is free.
Sign in to read the full lesson