Section 3: One Key, One Thread - Scale Estimation & Workload Analysis
Executive Summary: This section derives the leaderboard's whole workload from a handful of behavioral inputs, then checks it against the one constraint that governs the design: a Redis sorted set is one key, and one key lives on one node and is served by one main thread. Runs come out at 17,400 per second at the evening peak and 35,000 at the season-end surge. On each board's primary that is 34,800 and 70,000 sorted-set operations per second, against a 100,000 budget. The biggest board is 15 GB. Exact rank turns out to be cheap. Top-100 is the one read that must never hit Redis per request. The durable table sees only 4,350 improvements per second, and losing Redis costs a 5-minute rebuild. By the end you can show that it fits and name the number that breaks it first.
You said ZADD and ZREVRANK in Section 1, and the interviewer let it stand on one condition. Now they collect: "Fine. Prove it fits. And you told me player 40,000,000 gets an exact rank. Prove that's cheap too."
"Redis is fast" is a feeling, and a feeling doesn't pass this round. Turn players into runs, runs into operations, and put those operations on the right denominator: one main thread per board. Adding machines doesn't scale one key's writes, so this arithmetic is the whole argument for the design.
Lay the inputs on the table and invite correction:
Registered players                          200M
Players with at least one scored run        150M   (all-time board members)
Daily active players (DAU)                   50M
Weekly active (weekly board by Sunday)       80M
Runs per active player per day                10
Friends per player                            40 avg, 500 cap
Score per run                                 0 to 9,999,999 (the game's cap)
You: "I'm assuming ten runs a day per active player. Most runs end quickly, and players come back for several sessions a day. If it's closer to thirty, the write numbers triple, and I'll show you where that bites."
Writes: From Runs to Operations on One Thread
Runs per day:     50M DAU × 10 runs                = 500M runs/day
Average:          500M ÷ 86,400 s                  = 5,787 runs/s
Evening peak 3×:  5,787 × 3 = 17,361               ≈ 17,400 runs/s
Season-end 2×:    17,400 × 2 = 34,800              ≈ 35,000 runs/s  (design peak)
The surge isn't hypothetical. The weekly board freezes at Monday 00:00 UTC with rewards for the top 10,000, so Sunday night is when everyone near a reward line plays one more run.
Now comes the step most candidates skip. Each run touches two boards, weekly and all-time. On each board's primary, the Score Service runs one atomic script, ZADD key GT CH composite member followed by ZREVRANK, so that's two operations. A run that doesn't beat the player's best still pays both. GT evaluates and declines the update, and ZREVRANK still runs, because the player is waiting to see their rank.
Per board primary at peak:    17,400 runs/s × 2 ops   = 34,800 ops/s
Per board primary at surge:   35,000 runs/s × 2 ops   = 70,000 ops/s
Planning budget per primary:                            100,000 ops/s
Surge utilization:            70,000 ÷ 100,000        = 70% of budget
The 100,000 figure is deliberately conservative. A Redis primary can do more on simple commands, but a Lua script, replication to two replicas and the occasional snapshot fork all eat into it, so benchmark before you trust it. Notice what this arithmetic just decided: one board per primary. Put both boards on one primary and the surge becomes 2 × 70,000 = 140,000 ops/s, which is over budget. On separate primaries, they're two independent single-thread budgets.
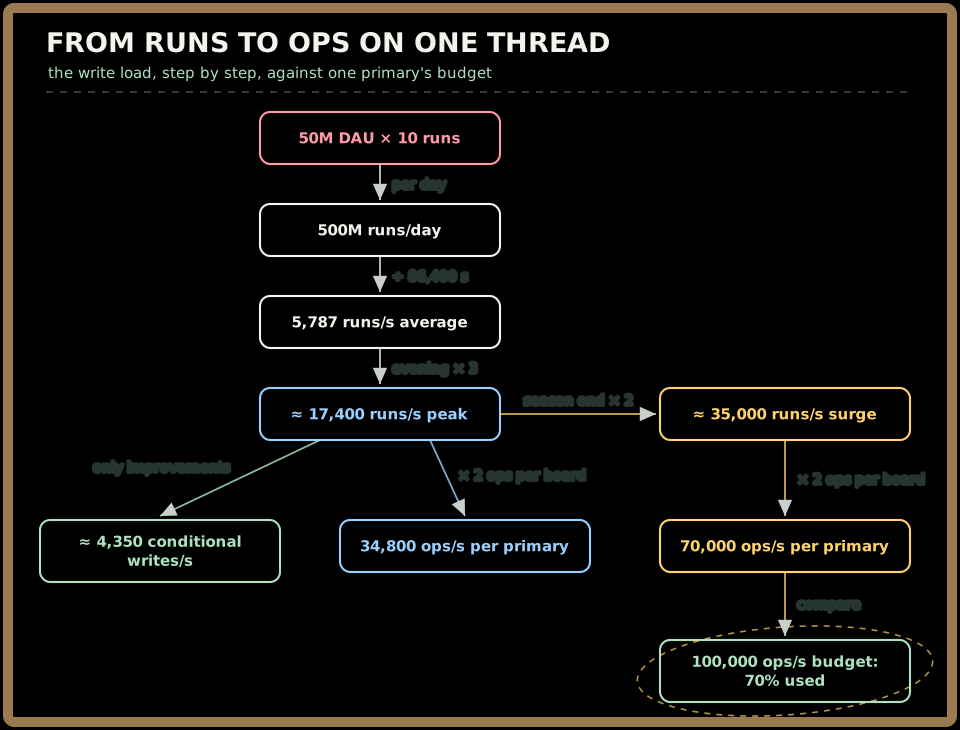
The durable side is far lighter, because a best score is a max and most runs don't beat your best:
All-time improvements:   17,400 × 5%    =   870/s
Weekly improvements:     17,400 × 20%   = 3,480/s
Conditional writes at peak                ≈ 4,350/s   ("only if greater")
Weekly improves four times as often because the week starts every player from zero. Every run still lands in the Kafka run-results log, which is the source of truth. The best-score table is built from it by the Best-Score Writer, a consumer with a per-partition in-memory best cache. The log is partitioned by playerId, so each consumer owns its players and the cache is exact. Only real improvements reach the table; the conditional write is the safety net. The rejected alternative, a DB-first synchronous write of every run to both boards' rows, would push 17,400 × 2 = 34,800 writes/s at the table. That's 8× the 4,350 that actually change anything.
Quick check before moving on:
Sign in to continue reading
The rest of this lesson is available with a free account. Signing in with Google or Microsoft is free.
Sign in to read the full lesson