Section 3: Small Numbers, Hard Semantics - Scale Estimation & Workload Analysis
Executive Summary: This section derives ClipKart's scale aloud, from 100M daily actives down to 694 order-line events per second on average and a 15,000 events/s sale-day design target, then sizes everything those events feed: about 5.6 GB of streaming state, a 5.8 GB hourly sort, a 32 GB rank snapshot, and read paths of 2,300 Top-10 requests/s and 116k rank lookups/s at sale peak. The verdict surprises most candidates: nothing here is big. The numbers make several decisions for us (exact counting, 64 Kafka partitions, a full hourly sort, a CDN for the shared lists), and they show that the hard parts of this system are semantic: sliding windows that retract, merges that must be exact, and a consistent snapshot served to every product page.
The requirements are on the board. The interviewer taps the table: "Before you draw boxes, how big is this?"
This is where the "Top-K" keyword does its damage. Candidates hear "most bought products" and reach for Count-Min Sketch before they have multiplied anything. The sketch solves a memory problem, and you don't yet know whether you have one. So you compute, out loud, and let the result tell you which machinery you may use.
From Shoppers to Events per Second
Start with people and end with events. ClipKart has 400M registered users and 100M daily actives. They place 30M orders a day, so about 0.3 orders per active user, which is plausible for a large marketplace where most visits are browsing. An order averages 2 line items, and each line is one event for us, because a line is one product:
Orders:            30M/day
Line items:        30M × 2           = 60M order-line events/day
Units:             60M × 1.2 units   = 72M units/day
Average rate:      60M ÷ 86,400 s    = 694 events/s  ≈ 700/s
Normal daily peak: 694 × 3           ≈ 2,100 events/s
Sale-day peak:     694.4 × 20        = 13,889 events/s
Design target:     rounded up        = 15,000 events/s
Cancellations:     5% of 60M lines   = 3M/day
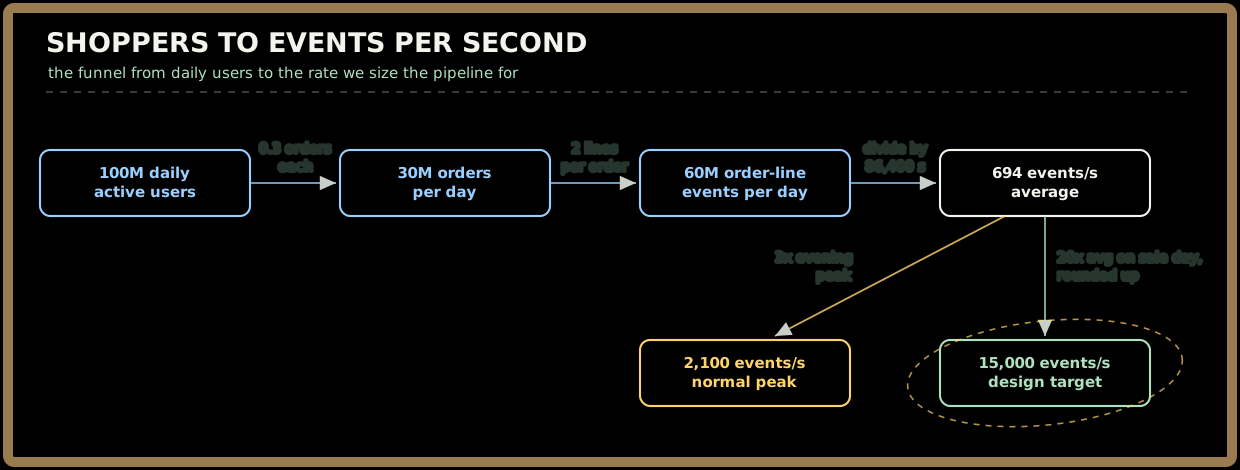
Priya's helmet purchase, order O-7731 line 2, is one of those 60M lines. During the evening sale it arrives alongside a flood of Nova X5 orders, and that flood is the interviewer's next question.
Interviewer: "Fine for a normal Tuesday. What about the big sale?"
You: "Sale days are the design point, not the exception. I'm assuming the sale peak is 20× the daily average, which gives 13,889 events/s, and I'll design for 15,000. The badges and the Top-10 button matter most exactly when traffic is highest, so I'm not willing to size for the average and hope. And 15,000 events/s is still a modest Kafka workload, as the bytes show."
Sign in to continue reading
The rest of this lesson is available with a free account. Signing in with Google or Microsoft is free.
Sign in to read the full lesson