Section 3: The Counter That Cannot Keep Up - Scale Estimation & Workload Analysis
Executive Summary: This section turns "Microsoft-scale" into numbers: 15M bucket decisions per second in the largest region, 30,000 per load balancer, about 6% of one core each. It then prices the design most candidates reach for first, a central Redis-style counter incremented on every request, and shows it failing twice: on the per-request round trip and on the single hottest key. Rate-share leasing brings coordination down to 500 batched reports per second per region. The finding: the scarce resources are the hot-path latency budget and the hottest key. Storage is not one of them.
The interviewer caps the marker. "Before you draw a box, how much work is the limiter doing?" The limiter carries no business load of its own. It sits in front of everyone else's, so its scale is the whole fleet's traffic multiplied by the number of rules each request touches.
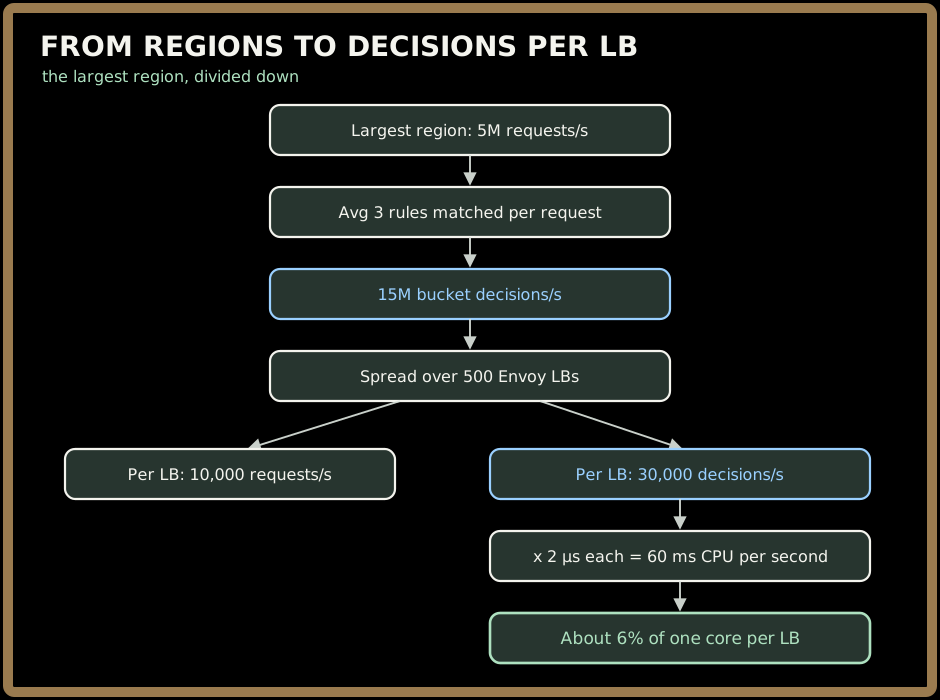
From Regions to Decisions per Load Balancer
Say each step aloud, so the interviewer can correct an input rather than an answer.
Regions: 20       Global peak: 40M requests/s (avg region 2M/s)
Largest region (West Europe): 5M requests/s

Rules matched per request: avg 3
  (service-wide protective cap + tenant + caller service or user)
Bucket decisions: 5M × 3 = 15M decisions/s

Load balancers in that region: 500 Envoy instances
Per LB:  5M ÷ 500 = 10,000 requests/s
         15M ÷ 500 = 30,000 decisions/s

Decision cost (in-memory bucket): ≈ 2 µs
CPU per LB: 30,000 × 2 µs = 60 ms of CPU per second ≈ 6% of one core
Remember the 6%. If the decision happens in memory, inside the load balancer that is already parsing the request, rate limiting is nearly free. Every later design has to keep it that way.
Sign in to continue reading
The rest of this lesson is available with a free account. Signing in with Google or Microsoft is free.
Sign in to read the full lesson