Logstash — Part 1: Foundations & Core Concepts
maang.io System Design Series
What is this?
Imagine a big city's central mail-sorting facility. All day, trucks back up to the loading docks and dump sacks of raw mail — handwritten postcards, typed invoices, parcels in five languages, some soggy, some with the postmark smudged. None of it is usable yet. Inside, a long sorting line does the real work: a worker reads each messy envelope, figures out the sender's city, fixes the smudged date, slaps on a clean barcode, and drops it into the right chute. At the far end, delivery trucks carry the now-tidy, labelled mail off to its destinations — some to the archive warehouse, some straight to the delivery route.
Logstash is that sorting facility, but for machine data. Raw logs, metrics, and events pour in from hundreds of servers in a dozen messy formats. Logstash reads each one, parses the chaos into clean structured fields, enriches it (adds the geographic location, fixes the timestamp), and ships the tidy result to wherever it needs to live — most famously Elasticsearch, so you can search it. It is the "L" in the classic ELK stack (Elasticsearch, Logstash, Kibana).
The one-line idea: Logstash is a pluggable data pipeline with exactly three stages — inputs collect raw events, filters parse and transform them, outputs ship them out — and almost everything you'll ever do is choosing plugins for those three boxes and writing the filter rules in the middle.
We'll keep coming back to this mail-sorting facility across all three parts, because every hard question about Logstash — durability, backpressure, why it's so hungry for memory — is really a question about how a sorting facility behaves when the trucks arrive faster than the line can sort.
1. The problem: logs are a mess, and search needs structure
Before you can use logs — search them, alert on them, chart them — they have to be structured. But a raw log line is just text. Here's a real one from an Nginx web server:
192.0.2.14 - - [06/Jul/2026:13:55:36 +0000] "GET /pricing HTTP/1.1" 200 2326 "-" "Mozilla/5.0"
To a human that's readable. To a search engine it's an opaque string. You can't ask "show me all 500 errors from India in the last hour" because there is no status field, no country field — there's just one blob of characters. Multiply this by every service using a different format (your app logs JSON, your database logs its own thing, your firewall logs yet another), and you have a swamp.
What was painful before a tool like Logstash existed:
- Every team wrote bespoke parsing scripts — brittle regexes in Perl or Python, one per log format, each a maintenance burden.
- No common enrichment. Want to turn every IP into a country? Every team reinvented it.
- No buffering. If your storage backend hiccupped, your parser either dropped data or fell over.
- Fan-out was manual. Sending the same event to both long-term storage and the search index meant custom plumbing.
Logstash replaced all of that with one configurable engine: a library of 200+ ready-made plugins for inputs, filters, and outputs, so instead of writing parsers you configure them.
💡 The mental shift: you're not programming a data transformer, you're assembling one out of pre-built parts. That's why Logstash configs read like a recipe, not like code.
2. The core model: input → filter → output
Every Logstash pipeline is these three stages, and the mail facility maps onto them one-to-one:
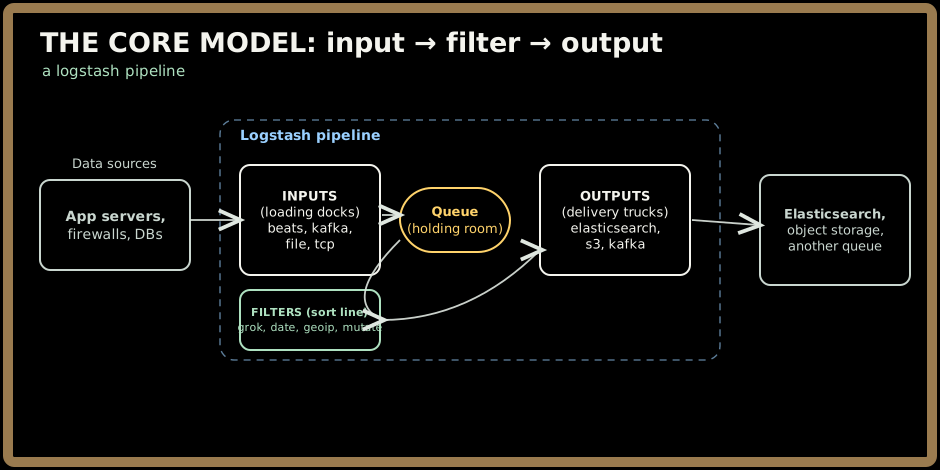
Let's name each stage properly, because these four words — input, filter, output, codec — are the whole vocabulary.
Inputs — the loading docks. An input is a plugin that pulls or receives raw data. The most important ones:
beats— receives from Beats shippers (more on those in Section 4). This is the most common production input.kafka— consumes from an Apache Kafka topic (see the Apache Kafka topic in this tier).file— tails a log file on disk.tcp/udp/http— listen on a socket.
Filters — the sorting line. This is where the real work happens: parsing the raw blob into fields and enriching it. The workhorses:
grok— pattern-matches unstructured text into named fields (the single most important filter — Section 3).dissect— a faster, regex-free alternative to grok for cleanly-delimited text.date— parses a timestamp string out of the log and sets the event's official@timestamp.geoip— looks up an IP address in a geographic database and addscity,country,latitude/longitude.mutate— the swiss-army knife: rename, remove, convert-type, uppercase, or replace fields.useragent,kv,json,csv,translate— parse specific shapes.
Outputs — the delivery trucks. Where the tidy event goes. You can have many outputs at once (fan-out):
elasticsearch— index it for search/Kibana (the classic destination).s3/ object storage — cheap long-term archive (see Object Storage).kafka— hand off to another system.stdout— print to console (for debugging, usually with therubydebugcodec).
Codecs — the language interpreter at the dock or the truck. A codec decodes incoming bytes into events (or encodes events out). It runs at the input/output boundary, not as a separate stage. The key ones:
json— the incoming line is already JSON; parse it into fields directly (no grok needed).multiline— stitch several physical lines into one event. This is how a Java stack trace (which spans 30 lines) becomes a single log event instead of 30 broken ones.plain,line— raw text.
💡 Codec vs filter — a common point of confusion. A codec works at the edge, on the wire format ("these bytes are JSON"). A filter works inside, on an already-decoded event ("extract the status code from this field"). If your data arrives as clean JSON, a
jsoncodec on the input can do the parsing agrokfilter would otherwise do — cheaper and simpler.
Quick check before moving on:
3. Grok: turning a blob into fields
Grok is the star of the sorting line, so it deserves a proper look. It's a pattern-matching language built on named regular expressions. You write a pattern using %{SYNTAX:field_name} tokens, where SYNTAX is a pre-defined named pattern (like IP, NUMBER, WORD) and field_name is the field to store the captured value in.
Here's grok reading that Nginx line from Section 1:
filter {
  grok {
    match => { "message" => '%{IP:client_ip} - - \[%{HTTPDATE:log_time}\] "%{WORD:method} %{URIPATH:path} HTTP/%{NUMBER:http_version}" %{NUMBER:status:int} %{NUMBER:bytes:int}' }
  }
  date {
    match => [ "log_time", "dd/MMM/yyyy:HH:mm:ss Z" ]   # fix the @timestamp
  }
  geoip {
    source => "client_ip"                                # add country / lat-lon
  }
}
After this runs, the opaque string has become a clean document:
{
  "client_ip": "192.0.2.14",
  "method": "GET",
  "path": "/pricing",
  "status": 200,
  "bytes": 2326,
  "geoip": { "country_name": "United States", "location": { "lat": 37.7, "lon": -122.4 } },
  "@timestamp": "2026-07-06T13:55:36.000Z"
}
Now you can ask "all 500s from India in the last hour," because status and geoip.country_name are real, typed, searchable fields. That transformation — blob to document — is the entire reason Logstash exists.
⚠️ Grok is regex under the hood, and regex can be catastrophically slow when a pattern backtracks over an input that almost matches. A sloppy
.*-heavy grok pattern is one of the most common ways to peg Logstash's CPU at 100%. We'll dig into why in Part 2, and when to reach fordissectinstead.
Quick check before moving on:
4. Beats: the lightweight couriers (and the standard topology)
Here's a crucial piece that shapes almost every real deployment. Logstash runs on the JVM (it's written in JRuby), and to do heavy parsing it wants a healthy chunk of memory — a 1 GB heap by default. You do not want to install something that heavy on all 2,000 of your application servers just to collect their logs.
So Elastic built Beats: tiny, single-purpose data shippers written in Go, each with a footprint of a few tens of megabytes. Filebeat tails log files, Metricbeat collects metrics, Packetbeat sniffs network data. A Beat does almost no processing — it just reads and ships. Think of Beats as bicycle couriers: they pick up mail from each building and pedal it to the central facility. They don't sort; sorting is the facility's job.
This gives you the canonical ELK topology:
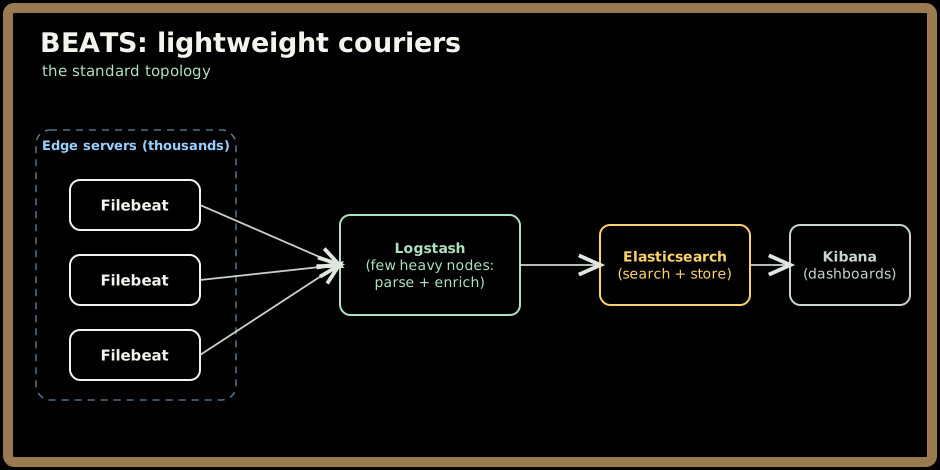
Beats → Logstash → Elasticsearch → Kibana. Lightweight collection at the edge, heavy transformation centralised on a few Logstash nodes, search-and-store in Elasticsearch, dashboards in Kibana. When traffic is spiky or you need a durable buffer, you slot a Kafka cluster between Beats and Logstash (Beats → Kafka → Logstash → Elasticsearch) — that's the Asynchronous Messaging pattern applied to log ingestion, and we'll return to it in Parts 2 and 3.
Quick check before moving on:
5. When to reach for Logstash — and when not
Logstash is not the only way to get data into Elasticsearch, and a Staff engineer knows the alternatives:
| Option | What it is | Reach for it when… |
|---|---|---|
| Logstash | Full pipeline: parse, enrich, buffer, fan-out to many outputs. Heavy (JVM). | You need complex transformation, enrichment (geoip, lookups), a durable buffer, or multiple destinations. |
| Beats alone | Lightweight ship straight to Elasticsearch, minimal processing. | Data is already clean/JSON and you just need to move it cheaply. |
| Elasticsearch Ingest Pipelines | Grok-and-transform processors that run inside Elasticsearch's own ingest nodes. No separate tier. | You need light parsing but don't want to operate a Logstash cluster. |
| Kafka + a stream processor (Flink/Storm) | Full stream processing for stateful, windowed analytics. | You need joins, aggregations, or windowing — beyond simple per-event transform (see Apache Flink / Apache Storm). |
The honest summary: reach for Logstash when the transformation is non-trivial or you need buffering and fan-out. Skip it when your data is already clean (Beats direct) or when your parsing is simple enough for Elasticsearch's own ingest pipelines. And when you need real stream processing — stateful aggregation across events, not just per-event cleanup — Logstash is the wrong layer; that's Flink/Storm territory.
🚫 A classic mistake: using Logstash as a message queue. It has an internal queue (Part 2) for durability and backpressure, but it is not Kafka. If you need a real, replayable, multi-consumer buffer, put Kafka in front of Logstash — don't ask Logstash's queue to be one.
6. A complete minimal config
Putting the three stages together, a full working pipeline is just three blocks in a .conf file:
input {
  beats { port => 5044 }                 # receive from Filebeat over the Lumberjack protocol
}

filter {
  grok    { match => { "message" => "%{COMBINEDAPACHELOG}" } }
  date    { match => [ "timestamp", "dd/MMM/yyyy:HH:mm:ss Z" ] }
  geoip   { source => "clientip" }
}

output {
  elasticsearch {
    hosts => ["https://es:9200"]
    index => "weblogs-%{+YYYY.MM.dd}"    # a fresh daily index
  }
}
That's a production-shaped log pipeline: receive from Beats, parse the web log, fix the timestamp, add geography, index into a daily Elasticsearch index. Everything else in this deep-dive is about making this durable, fast, and correct under failure.
7. Key takeaways
- Logstash is a three-stage pipeline — input → filter → output — plus codecs at the edges. Learn those four words and you know the shape of every Logstash config. It's the ingest/ETL layer of the ELK stack.
- The value is transformation: raw, unstructured log blobs become clean, typed, searchable documents. Grok is the workhorse that pattern-matches text into fields;
date,geoip, andmutatefix and enrich them. - It's heavy (JVM, ~1 GB heap by default), so you don't run it everywhere. Beats — tiny Go shippers — collect at the edge and hand off to a few central Logstash nodes: the canonical Beats → Logstash → Elasticsearch → Kibana topology.
- Codecs decode the wire format (JSON, multiline stack traces) at the input/output boundary; filters transform already-decoded events. Knowing the difference saves you needless grok.
- Reach for Logstash when transformation is non-trivial or you need buffering/fan-out; skip it for clean data (Beats direct) or simple parsing (Elasticsearch ingest pipelines), and never mistake its internal queue for a real message bus like Kafka.
Test yourself on this part's key ideas:
Next, Part 2 goes under the hood: how the pipeline actually executes with worker threads and batches, the in-memory vs persistent queue decision that governs durability and backpressure, why grok can melt a CPU, and the failure modes a Staff engineer must anticipate.